

Water Quality - 2021
First, who’s watching out for the LCO lakes?
The LCO lakes are being monitored from multiple directions. First, the Wisconsin Department of Natural Resources establishes the regulatory framework for protection of Wisconsin lakes, and WDNR tasks its own biologists with monitoring fishery health and water quality. WDNR is the conduit by which legislative remedies to environmental threats become real.
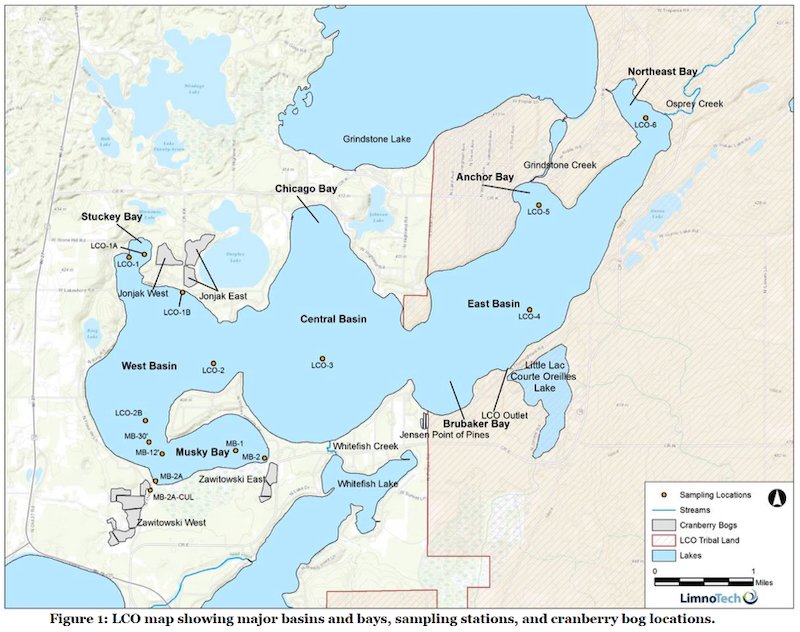
Second, even though only one third of the LCO lakes is on Tribal land, the LCO Conservation Department has taken on the essential role looking after the entire lake system. The LCOCD oversees most of the weekly/biweekly water sampling and analysis at multiple lake locations throughout the summer (see diagram below). LCOCD has done this for decades resulting in a trusted database for scientific inquiry and responsible decision-making. LCOCD provides the reliable “on the water” eyes and ears.
Finally, COLA, through its volunteers and contractual arrangements with LimnoTech and other scientists, assesses water-quality data generated by LCOCD and relates these findings to the legal framework set by WDNR to protect the lakes. COLA also communicates this information to a broad audience and proposes/conducts protective actions.
Three indicators of water quality are sufficient to provide an overview of LCO’s status in 2021: clarity, chlorophyll a (an indicator of algal growth), and phosphorus. The resultant effects on the overall health of the LCO fishery are reported here.
Clarity and Chloropyhll a


Two of the indicators in 2021, clarity and chlorophyll a are neutral to encouraging. At the East Basin deep hole, average water clarity during the recreational season increased, when compared to the previous five years, to 15.6 ft. However, there is still a significant long-term downward trend from 2008 (see accompanying diagram).
Chlorophyll a provides a measure of algal mass and the potential for algal blooms, which are difficult to predict because they occur suddenly due to rapidly shifting local conditions. Water temperature, nutrient concentration, wind, and water currents vary widely across the many bays in LCO, and algae growth can rapidly explode and then dissipate in a matter of days. The good news is that the LCO lakes show no propensity for extraordinary algal blooms (see accompanying diagram). Not to say that we haven’t had them in the past (see 2016 report), but algal blooms, unless excessive, are part of nature’s pattern.
Click on individual diagrams for larger graphs and more information.
Phosphorus

Phosphorus concentrations throughout LCO were higher in 2021 than in previous years. As shown in the accompanying graph, over the last 20 years, the average phosphorus concentration of LCO’s major basins has increased from around 10 µg/L to over 17 µg/L This represents an annual rate of 0.3 µg/L, which is highly significant statistically as well as being quite alarming. The proposed protective upper limit for the phosphorus criterion is 10 µg/L as shown by the orange line.
Here are the main findings of the 2021 WisCALM report prepared for COLA by LimnoTech:
The area-weighted lake-wide average (including minor basins) phosphorus concentration (18.2 µg/L) was 20% higher than the overall weighted average during the entire 2017-2021 assessment period (15.2 µg/L).
The station specific phosphorus concentrations in 2021 were consistently the highest or second highest in the past 3 to 5 years.
All Major Basin sampling locations had average phosphorus concentrations exceeding the current two-story fishery maximum criterion set by WDNR (15 µg/L).
Musky Bay phosphorus concentrations (39.7 µg/L) did not exceed the shallow drainage lake criterion set by WDNR (40 µg/L), but Musky Bay’s phosphorus concentration has increased consistently over the past 3 years, up 41% from 2018.
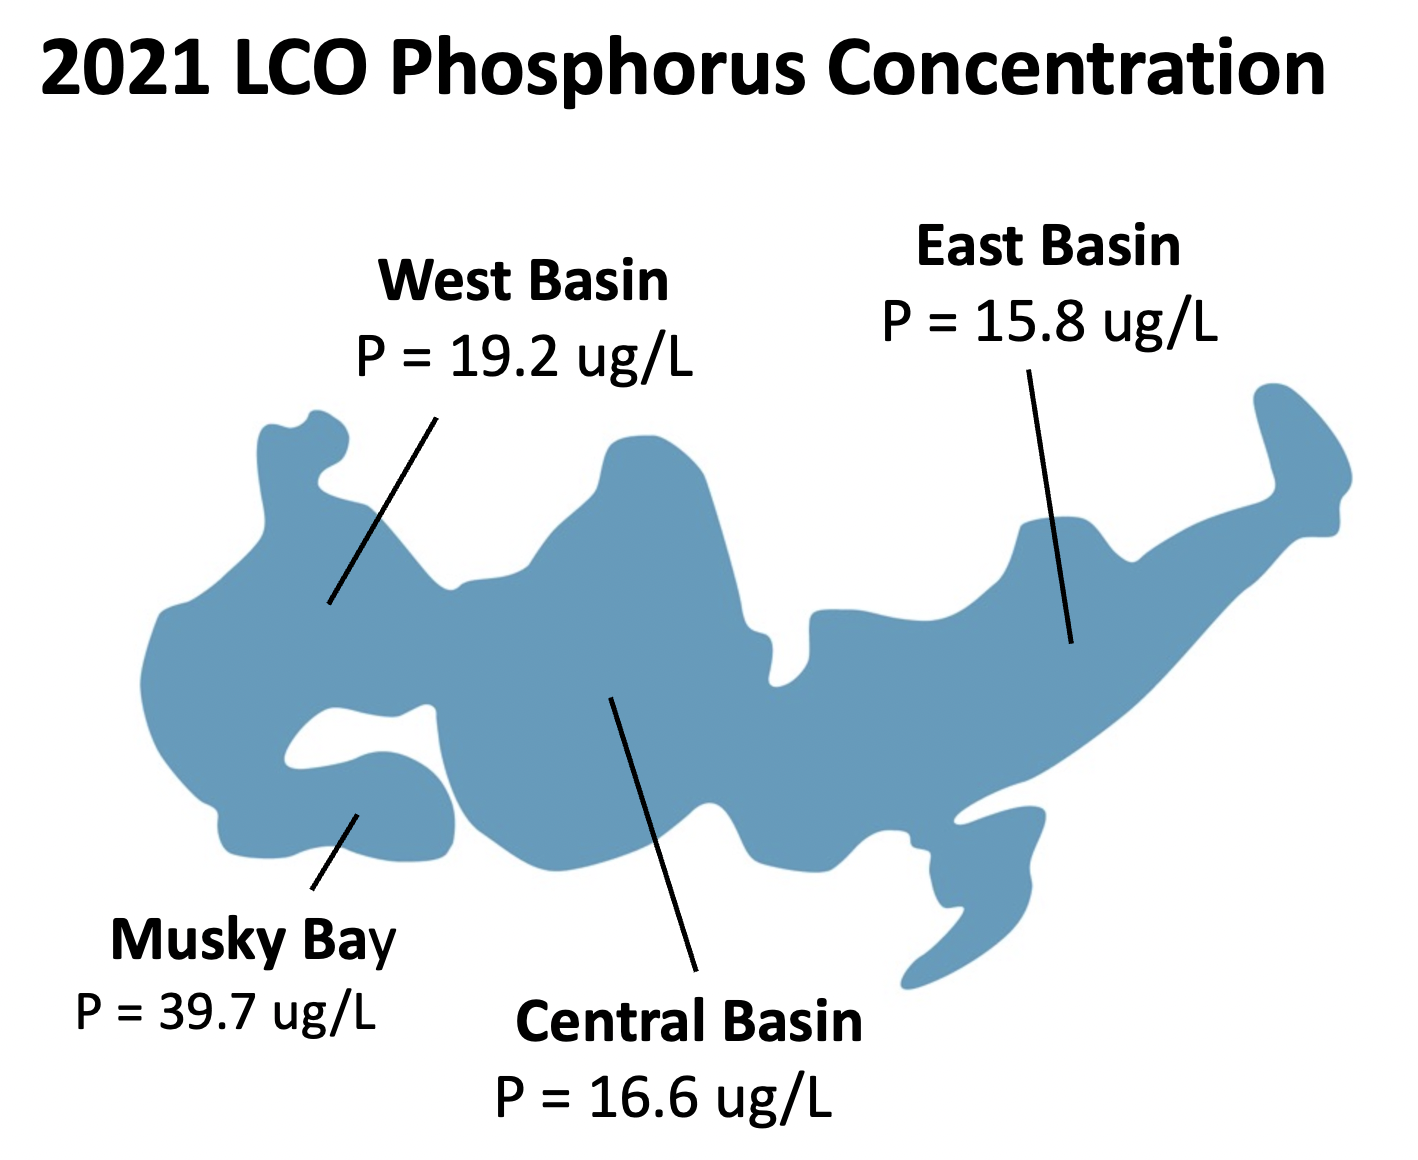
Phosphorus concentrations in 2021 increased from the east to the west across LCO’s Major Basins. The closer to Musky Bay, the higher the phosphorus.
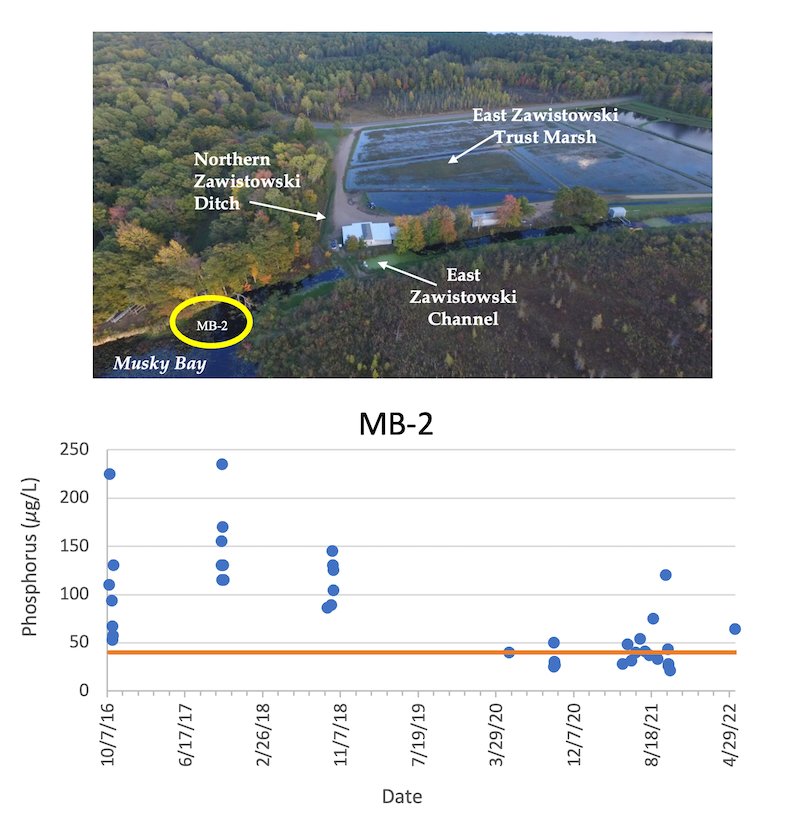
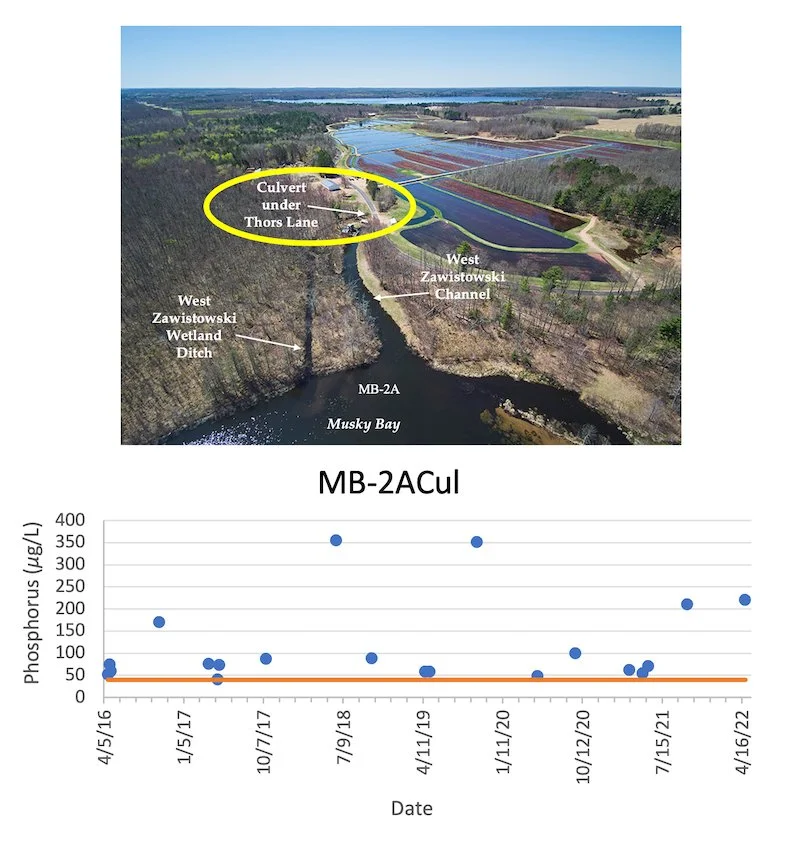
The LCOCD has been sampling water near discharge channels leading from the two cranberry marshes on Musky Bay since 2016. Water samples were usually collected on or around those days when water was being discharged into Musky Bay.
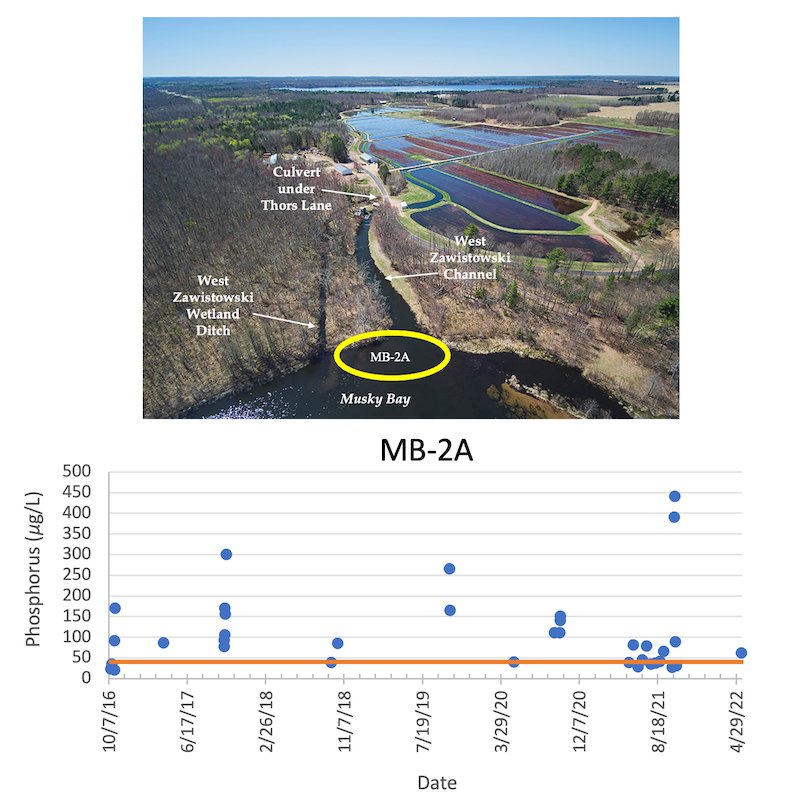
An irrigation return flow system was installed on the eastern marsh in 2015. It may have taken a few years, but it seems that at least since 2018, phosphorus concentrations have decreased at the MB-2 sampling site (see diagrams). However, the phosphorus concentrations at the larger (75 acre) western bog have been as high as 440 µg/L (10/14/21, MB-2A) and are typically substantially higher than the 40 µg/L upper limit set by WDNR (orange line). In spring 2022, the phosphorus concentration at MB-2ACul reached 220 on 4/29/22. In previous years, concentrations had been as high as 355 µg/L.
Where To From Here?
The major problem facing the LCO lakes is phosphorus, and phosphorus concentrations can be reduced - if there is the will to do it. COLA and the LCO Tribe have asked the WDNR to establish a Site Specific Criterion for phosphorus of 10 µg/L (rather than rely on the state-wide criterion of 15 µg/L). Yes, a previous effort in 2020 was turned back by the Natural Resources Board chaired by Fred Prehn after a tie vote. But now we have more data, more analyses, and more support from EPA, WDNR, and LCOCD scientists. A final decision by the Natural Resources Board is due in January, 2023.
When the LCO lakes receive the more protective 10 µg/L criterion, a number of avenues will open up for taking action. Most important, the new criterion will be an obvious, emphatic statement that LCO needs help to restore, or at least preserve, what remains of its two-story, cold-water fishery. We can only hope.